|
The TOOLS menu |
|
When viewing the recorded cross coherences a plot of each recorded coherence is given as well as a plot summarizing all recorded coherences. To clear the recorded coherences reload the ERPWAVELAB data file. |
|
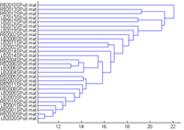
Dendrogram clustering datasets of similar activity together. |
|
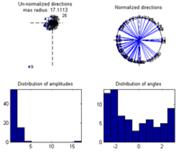
When ‘Show the distribution of complex coefficients through the epochs at current point’ the complex coefficients are plotted together with their distribution of amplitudes to the left and normalized to display the phase including the phase distribution to the right. |
|
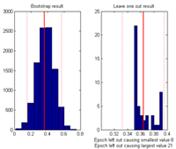
When ‘Show distribution of current measure at currently inspected point’ the value of the current measure is calculated for bootstrapped data samples (left) as well as by ‘leaving one epoch out’ at a time (right). Red line, value obtained using all epochs, red dotted line +/- 2 standard deviations. Below rightmost plot is given the two epochs the strongest influencing the measure achieved positively and negatively respectively. |

|
Developed by Morten Mørup |
|
A tOOLbox FOR MULTI-CHANNEL TIME-FREQUENCY ANALYSIS |


|
Dendrogram |
Calculates the Euclidian distance between the current measure of each loaded ERPWAVELAB file and clusters these measures into a dendrogram. The method used for clustering is ’Average’, thus each new connection is given to the cluster of datasets having an average distance over elements in the cluster being the smallest. Type ’help linkage’ in the MATLAB prompt for details. Notice: This function only works if the ’Statistics Toolbox’ is installed in MATLAB. |
|
Record cross coherence |
Once the coherence between two points has been selected, this coherence can be recorded by selecting this menu point. Note, the recorded coherences can only be removed by reloading the ERPWAVELAB file. To store the recorded coherences, select: File-> Save Session. |
|
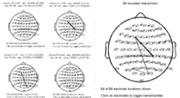
View recorded cross coherences |
Summarizes all the recorded coherences by displaying them individually as well as giving a head plot with all connectivities. The relative strength of each coherence is given by the intensity of the arrows and significance of each coherent activity is given in the individual plots. |
|
Reject trials marked by EEGLAB CURRENTSET |
If the full ERPWAVELAB dataset is generated containing the time-frequency transformed of all epochs (required for ERPCOH analysis and for calculating bootstrap significance), some of these epochs can be rejected by marking them for rejection in the corresponding EEGLAB dataset (see EEGLAB for how to reject epochs). ERPWAVELAB takes the mask used for rejection in EEGLAB and uses this to reject the data epochs in ERPWAVELAB. Consequently, the epochs should only be marked for rejection but not actually rejected in EEGLAB since the mask no longer exists once the epochs have been rejected in EEGLAB. |
|
Show distribution of complex coefficients through the epochs at current point |
Shows the distribution of the complex coefficients at the given point inspected. If use all is selected the complex coefficient of each epoch of all the dataset loaded into ERPWAVELAB is shown. Otherwise, the complex coefficient of each epoch of the current dataset is shown.
|
|
Show distribution of current measure at the currently inspected point |
Shows by bootstrapping over the epochs, and by ‘leave one (epoch) out’ how sensitive the value at the currently inspected point is to the epochs at hand. Thus, if a few epochs dominate the values found, these can be accessed from this inspection. |
|
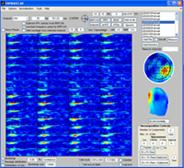
Show various measures at current channel |
Plots the ITPC, ITLC, ERSP, INDUCED, avWT, WTav of the current channel in a separate plot as well as a figure containing surface plots of avWT, WTav and INDUCED. |
|
|
|