|
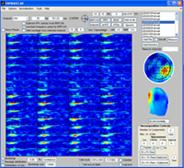
The montage plot |
|
The montage plot displays the current measure in the region of interest (ROI) arranging the channels as an m x n array. The channel names are given in the upper left corner of each array. If ‘Incl. Topmontage’ is selected from the plot options a topographical montage of the time frequency activities are shown in a separate figure. When clicking on a region on the montageplot, this point is set as the currently inspected point. |


|
Developed by Morten Mørup |
|
A tOOLbox FOR MULTI-CHANNEL TIME-FREQUENCY ANALYSIS |