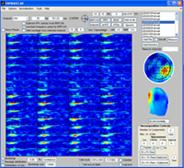
Specifying the color axis

Text Box: Here the color axis displayed in the montage plot is specified. When checking the ’Set axis to limits’ the color axis is set to be the range of the measure currently displayed. If ’Rem Backgr. Coh.’ is selected, the lower level is set to the theoretical random mean activity of the ITPC and ERPCOH. When ’Colorbar’ is checked the color bar used is displayed next to the montage plot while when ’Log-axis’ is checked the data is log transformed when displayed. Notice, when decomposing, the data is not kept log-transformed data as this would violate the non-negativity constraints of the algorithms.
Text Box:             ERPWAVELAB

Developed by Morten Mørup

A tOOLbox FOR MULTI-CHANNEL TIME-FREQUENCY ANALYSIS