|
The Topographical montage plot |
|
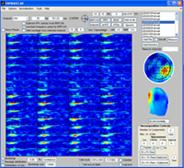
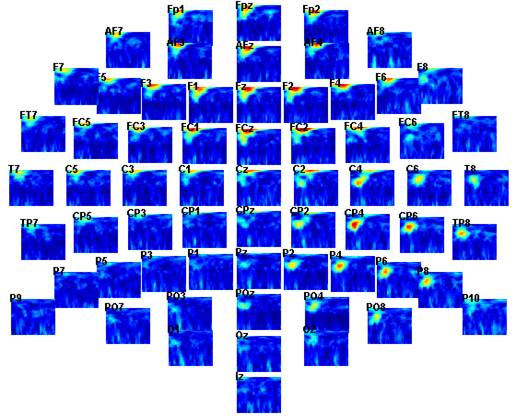
The topographical montage plot displays the current measure in the region of interest (ROI) showing the time-frequency plots at the actual channel locations. The Channel names are given in the upper left corner of each plot. The plot is given if the ‘incl Topmontage’ is selected in the plotting options. By clicking on a given channels on the topographical montage plot this channels time-frequency activity is given in a separate figure. |

|
Developed by Morten Mørup |
|
A tOOLbox FOR MULTI-CHANNEL TIME-FREQUENCY ANALYSIS |